UNH TDP - Concurrent Measurements of Inflow, Power Performance, and Loads for a Grid-Synchronized Vertical Axis Cross-Flow Turbine Operating in a Tidal Estuary

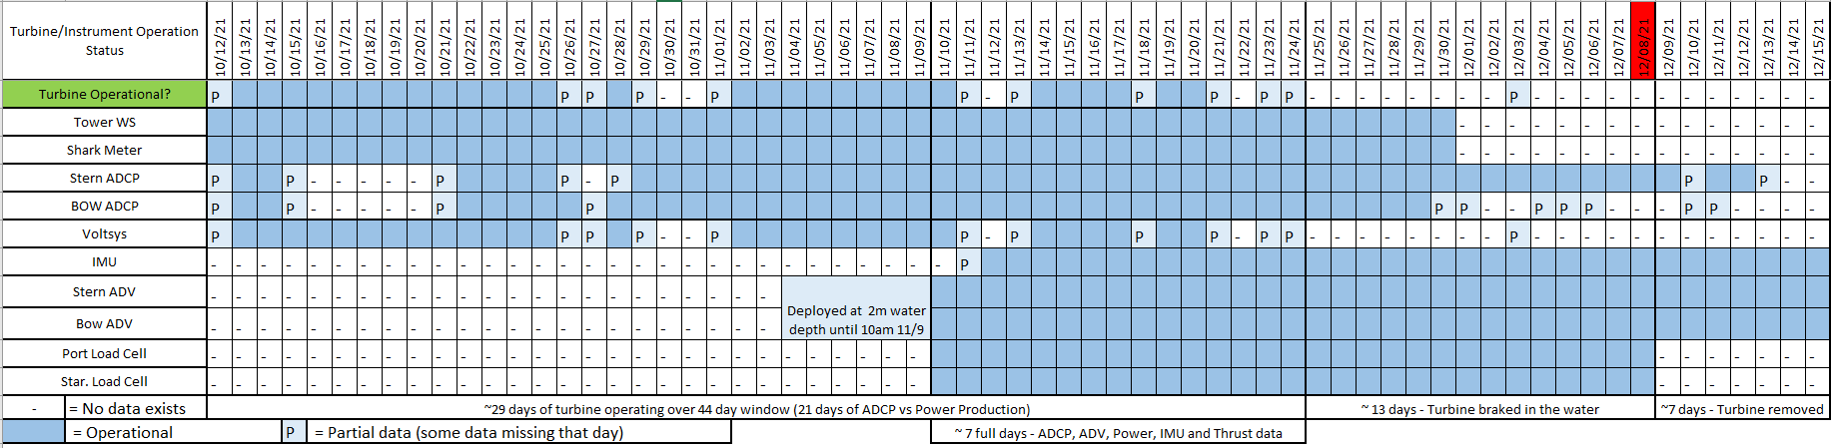
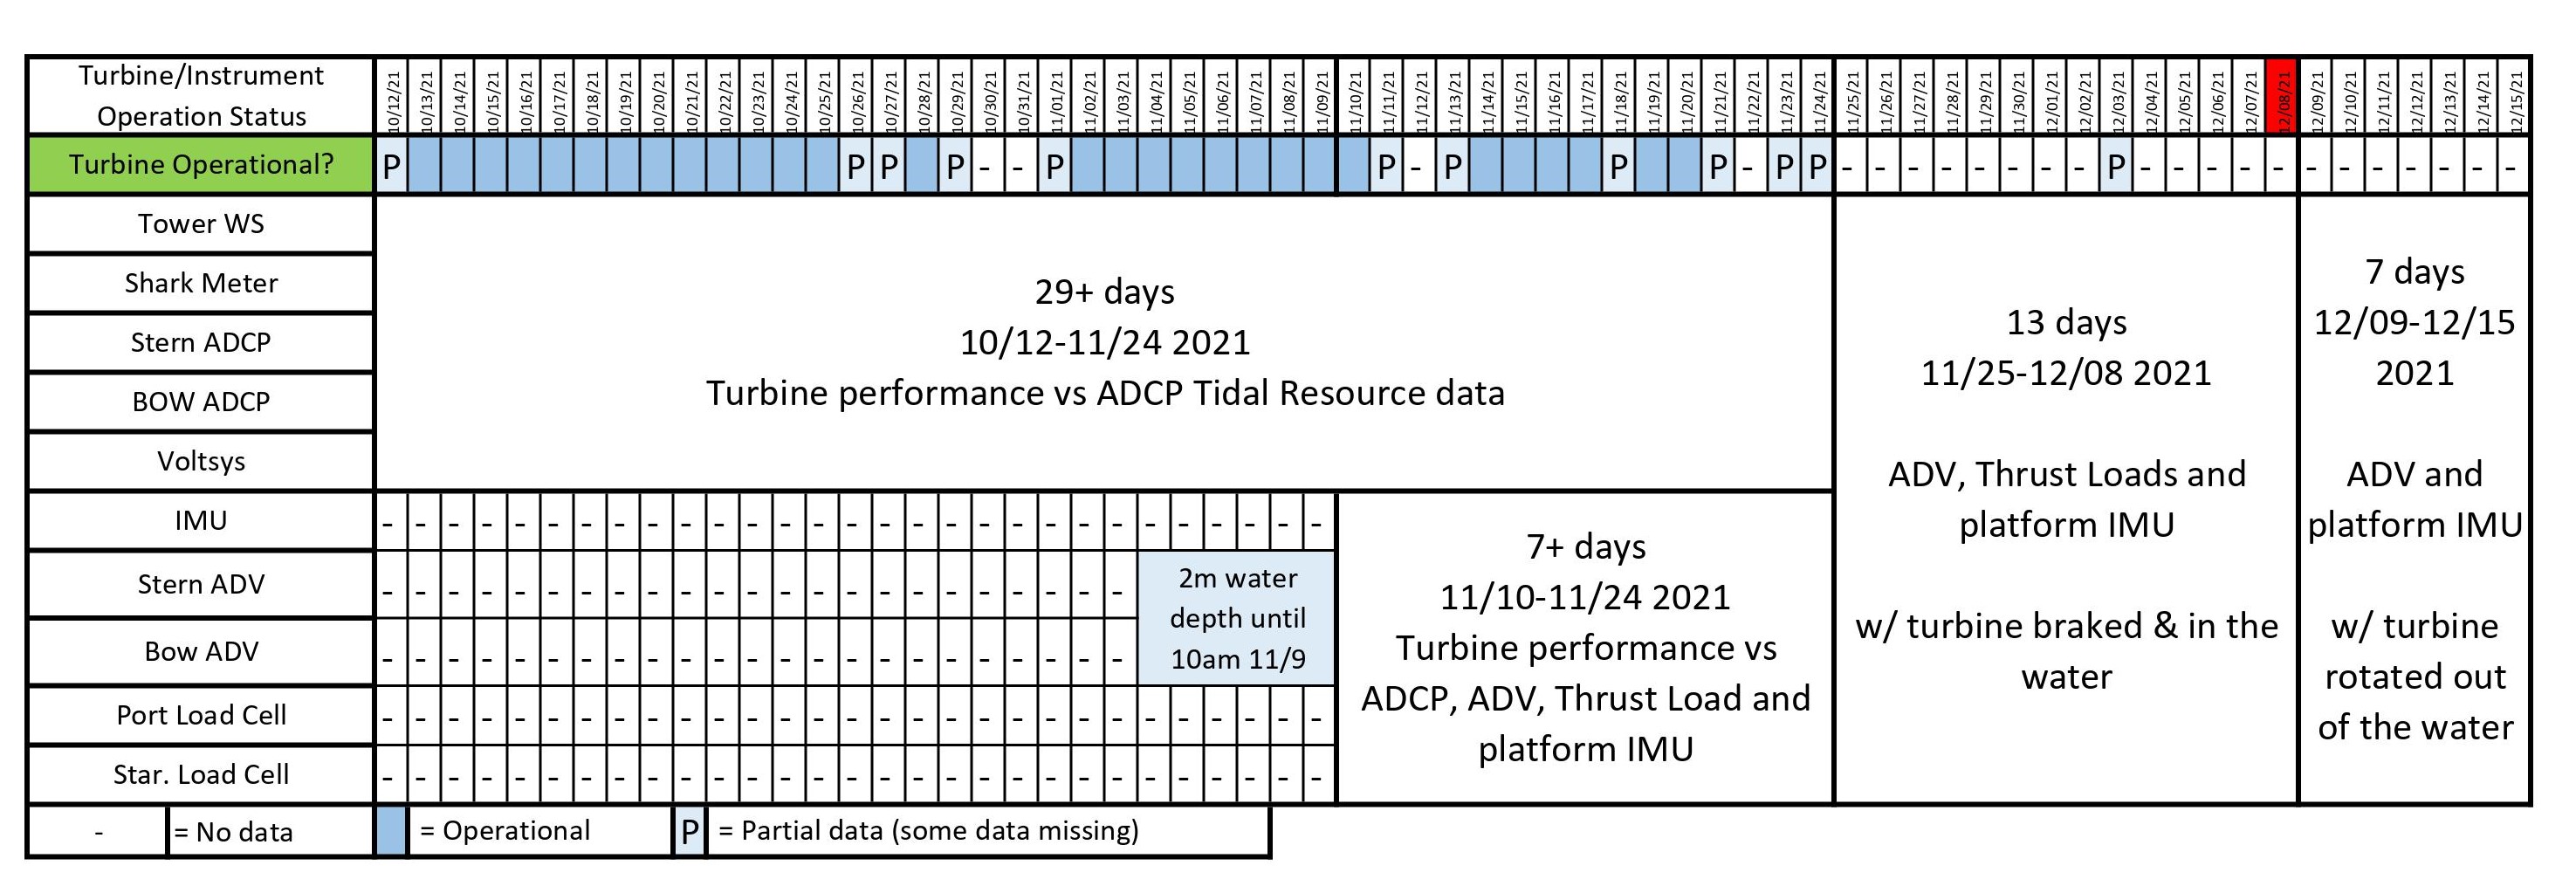
This data was collected between October 12 and December 15 of 2021 at the University of New Hampshire (UNH) and Atlantic Marine Energy Center (AMEC) turbine deployment platform (TDP). This data set includes over 29 days of grid connected turbine operation during this 65 day time frame. The priority for this measurement campaign was to collect data while the turbine was electrically connected to the grid by means of a rectifier and inverter. The Fall_2021_UNH_Measurement_Timeline.png highlights when each instrument was functioning and the Fall_2021_UNH_Test_Log.jpg indicates the four main regions for analysis available from this measurement campaign.
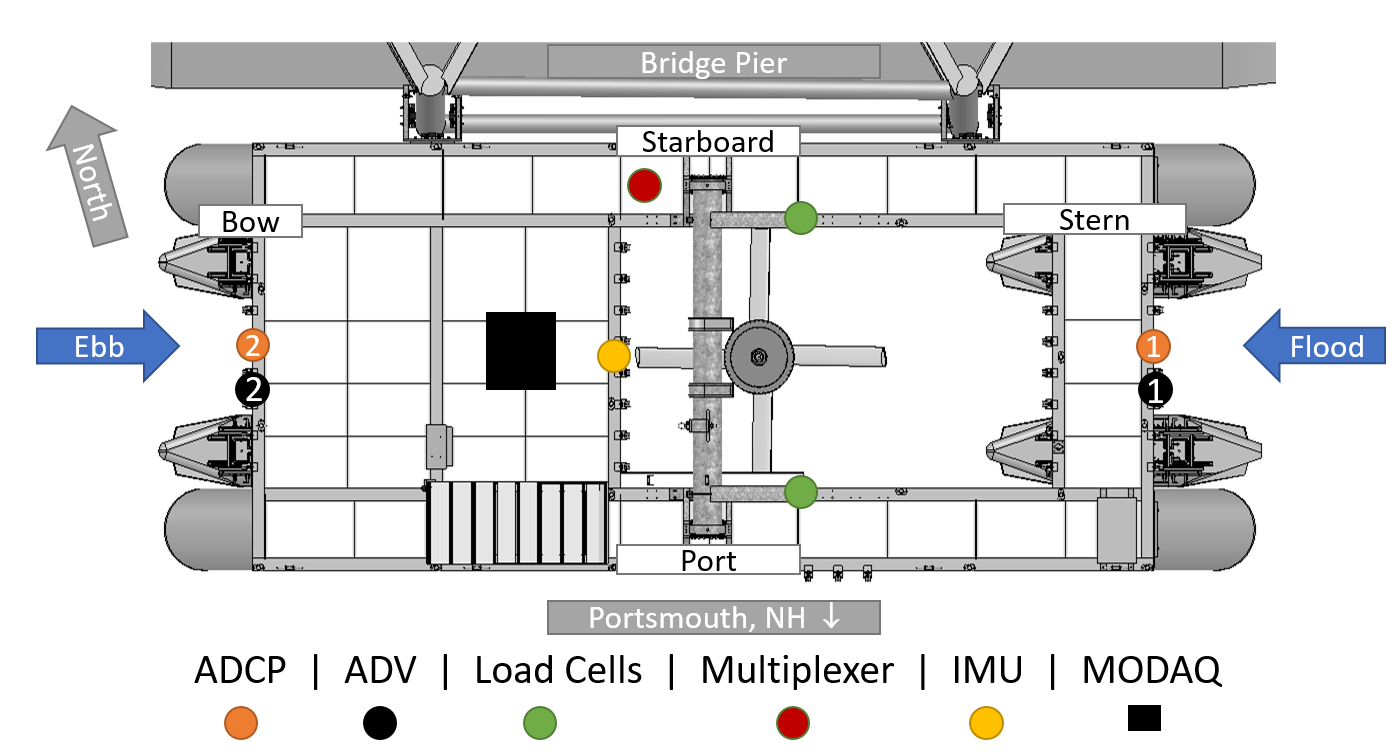
The TDP is a floating structure moored on the Portsmouth facing side of Memorial Bridge pier #2, which spans the Piscataqua River between Portsmouth, NH and Kittery, ME. The Piscataqua River connects the Great Bay Estuary to the Gulf of Maine and the river currents are dominated by tidal forcing with water velocities exceeding 2.5 m/s during spring ebb tides at this site which were previously characterized by Kaelin Chancey (Assessment Of The Localized Flow And Tidal Energy Conversion System At An Estuarine Bridge - UNH MS Thesis 2019).
The turbine under test was a modified New Energy Corporation (Calgary, CA) model EVG-025 4-blade H-Darrius type vertical axis cross flow turbine that rotates in the clockwise direction with a rotor diameter of 3.2m and blade length of 1.7m. The hydro-foil profile was a NACA 0021 with a 10 inch chord length and a blade preset pitch angle of +4deg with a positive angle corresponding with the toe in direction. The standard EVG-025 has a rotor diameter of 3.4m and its rated power output is 25kW at 3 m/s. The rotor diameter was reduced to accommodate the size of the existing TDP moon-pool.
This project was pursued to quantify device performance for cross flow turbines operating in a marine environment. Accurate physical models, to characterize cross flow turbine performance, require real operational data sets due to the complexity of blade fluid interactions. This data can help support model development which will help predict turbine performance when analyzing perspective project locations in the future. Instrumentation was deployed to measure; water speed/direction, electrical power output, turbine shaft speed, turbine thrust force, and platform motion. Concurrent measurements of these parameters allow for correlations (cause and affect) to be inferred, allowing for characterization of device performance over a range of operating conditions.
Water currents were measured using Acoustic Doppler Current Profilers (ADCP's) and Acoustic Doppler Velocimeters (ADV's) directly upstream and downstream of the turbine for inflow, wake and turbulence measurements. Electrical power output was measured using the Voltsys rectifier and the Shark power meter. Shaft speed was calculated based on the Voltsys measurements of the permanent magnet three phase generator AC generation frequency, coupled directly to the cross flow turbine under test (i.e., no gear box). Platform motions were captured using a Yost IMU (inertial measurement unit). Turbine thrust loading was measured using a reaction arm about the turbine deployment platform spanning beam, where two bi-directional load cells were connected to the system via a pinned connection.
This submission includes zipped folders for each instrument containing quality controlled (QC'd) data in daily .csv files for the relevant duration specific to each instrument, along with separate .csv file that contains the units for each variable. Some instrument daily files are quite large and can pose a challenge for a visual spreadsheet editor to open. A processing software like MATLAB or Python is recommended. Note the degree of QC varied between each instrument due to time constraints. Particular time and attention was given to perform quality control tests on the acoustic based instruments that are particularly susceptible to erroneous data reporting. All variables across all instruments were verified for name and proper units. A complete reference on the QC tests performed and subsequent data reported here is available in 2022 - OByrne MS Thesis Chapter 4.
The zipped file structure, Data_Viewing_Matlab_Scripts, contains the same QC'd data reported in .csv files, but in .mat format, along with basic viewing and in depth processing scripts used to produce the results presented in 2022 - OByrne MS Thesis. To run the viewing and analysis and scripts available in the Data_Viewing_Matlab_scripts zip directory MATLAB R2021a is recommended.
The viewer is directed to 2022 - OByrne MS Thesis for an introduction to the platform and turbine under test.
Individual submissions will be created for each instrument to disseminate the raw data along with the .mat processing scripts used to create the final data set reported in this submission.

Citation Formats
TY  - DATA
AB  - This data was collected between October 12 and December 15 of 2021 at the University of New Hampshire (UNH) and Atlantic Marine Energy Center (AMEC) turbine deployment platform (TDP). This data set includes over 29 days of grid connected turbine operation during this 65 day time frame. The priority for this measurement campaign was to collect data while the turbine was electrically connected to the grid by means of a rectifier and inverter. The Fall_2021_UNH_Measurement_Timeline.png highlights when each instrument was functioning and the Fall_2021_UNH_Test_Log.jpg indicates the four main regions for analysis available from this measurement campaign.

The TDP is a floating structure moored on the Portsmouth facing side of Memorial Bridge pier #2, which spans the Piscataqua River between Portsmouth, NH and Kittery, ME. The Piscataqua River connects the Great Bay Estuary to the Gulf of Maine and the river currents are dominated by tidal forcing with water velocities exceeding 2.5 m/s during spring ebb tides at this site which were previously characterized by Kaelin Chancey (Assessment Of The Localized Flow And Tidal Energy Conversion System At An Estuarine Bridge - UNH MS Thesis 2019).

The turbine under test was a modified New Energy Corporation (Calgary, CA) model EVG-025 4-blade H-Darrius type vertical axis cross flow turbine that rotates in the clockwise direction with a rotor diameter of 3.2m and blade length of 1.7m. The hydro-foil profile was a NACA 0021 with a 10 inch chord length and a blade preset pitch angle of +4deg with a positive angle corresponding with the toe in direction. The standard EVG-025 has a rotor diameter of 3.4m and its rated power output is 25kW at 3 m/s. The rotor diameter was reduced to accommodate the size of the existing TDP moon-pool.

This project was pursued to quantify device performance for cross flow turbines operating in a marine environment. Accurate physical models, to characterize cross flow turbine performance, require real operational data sets due to the complexity of blade fluid interactions. This data can help support model development which will help predict turbine performance when analyzing perspective project locations in the future. Instrumentation was deployed to measure; water speed/direction, electrical power output, turbine shaft speed, turbine thrust force, and platform motion. Concurrent measurements of these parameters allow for correlations (cause and affect) to be inferred, allowing for characterization of device performance over a range of operating conditions.

Water currents were measured using Acoustic Doppler Current Profilers (ADCP's) and Acoustic Doppler Velocimeters (ADV's) directly upstream and downstream of the turbine for inflow, wake and turbulence measurements. Electrical power output was measured using the Voltsys rectifier and the Shark power meter. Shaft speed was calculated based on the Voltsys measurements of the permanent magnet three phase generator AC generation frequency, coupled directly to the cross flow turbine under test (i.e., no gear box). Platform motions were captured using a Yost IMU (inertial measurement unit). Turbine thrust loading was measured using a reaction arm about the turbine deployment platform spanning beam, where two bi-directional load cells were connected to the system via a pinned connection.

This submission includes zipped folders for each instrument containing quality controlled (QC'd) data in daily .csv files for the relevant duration specific to each instrument, along with separate .csv file that contains the units for each variable. Some instrument daily files are quite large and can pose a challenge for a visual spreadsheet editor to open. A processing software like MATLAB or Python is recommended. Note the degree of QC varied between each instrument due to time constraints. Particular time and attention was given to perform quality control tests on the acoustic based instruments that are particularly susceptible to erroneous data reporting. All variables across all instruments were verified for name and proper units. A complete reference on the QC tests performed and subsequent data reported here is available in 2022 - OByrne MS Thesis Chapter 4.

The zipped file structure, Data_Viewing_Matlab_Scripts, contains the same QC'd data reported in .csv files, but in .mat format, along with basic viewing and in depth processing scripts used to produce the results presented in 2022 - OByrne MS Thesis. To run the viewing and analysis and scripts available in the Data_Viewing_Matlab_scripts zip directory MATLAB R2021a is recommended.

The viewer is directed to 2022 - OByrne MS Thesis for an introduction to the platform and turbine under test.

Individual submissions will be created for each instrument to disseminate the raw data along with the .mat processing scripts used to create the final data set reported in this submission.
AU  - Wosnik, Martin
A2  - O'Byrne, Patrick
A3  - Nichols, Casey
A4  - Bharath, Aidan
A5  - Bichanich, Mason
A6  - Hunt, Jon
A7  - Raye, Robert
A8  - Monahan, Michael
DB  - Marine and Hydrokinetic Data Repository
DP  - Open EI | National Laboratory of the Rockies
DO  - 10.15473/1973860
KW  - MHK
KW  - Marine
KW  - Hydrokinetic
KW  - energy
KW  - power
KW  - Tidal
KW  - Living Bridge
KW  - Grid Connected
KW  - Experimental Data
KW  - Field Data
KW  - tidal current
KW  - cross-flow
KW  - cross flow
KW  - vertical axis
KW  - code
KW  - technology
KW  - processed data
KW  - MATLAB
LA  - English
DA  - 2021/12/21
PY  - 2021
PB  - National Renewable Energy Laboratory
T1  - UNH TDP - Concurrent Measurements of Inflow, Power Performance, and Loads for a Grid-Synchronized Vertical Axis Cross-Flow Turbine Operating in a Tidal Estuary
UR  - https://doi.org/10.15473/1973860
ER  -
Wosnik, Martin, et al. UNH TDP - Concurrent Measurements of Inflow, Power Performance, and Loads for a Grid-Synchronized Vertical Axis Cross-Flow Turbine Operating in a Tidal Estuary. National Renewable Energy Laboratory, 21 December, 2021, Marine and Hydrokinetic Data Repository. https://doi.org/10.15473/1973860.
Wosnik, M., O'Byrne, P., Nichols, C., Bharath, A., Bichanich, M., Hunt, J., Raye, R., & Monahan, M. (2021). UNH TDP - Concurrent Measurements of Inflow, Power Performance, and Loads for a Grid-Synchronized Vertical Axis Cross-Flow Turbine Operating in a Tidal Estuary. [Data set]. Marine and Hydrokinetic Data Repository. National Renewable Energy Laboratory. https://doi.org/10.15473/1973860
Wosnik, Martin, Patrick O'Byrne, Casey Nichols, Aidan Bharath, Mason Bichanich, Jon Hunt, Robert Raye, and Michael Monahan. UNH TDP - Concurrent Measurements of Inflow, Power Performance, and Loads for a Grid-Synchronized Vertical Axis Cross-Flow Turbine Operating in a Tidal Estuary. National Renewable Energy Laboratory, December, 21, 2021. Distributed by Marine and Hydrokinetic Data Repository. https://doi.org/10.15473/1973860
@misc{MHKDR_Dataset_394,
title = {UNH TDP - Concurrent Measurements of Inflow, Power Performance, and Loads for a Grid-Synchronized Vertical Axis Cross-Flow Turbine Operating in a Tidal Estuary},
author = {Wosnik, Martin and O'Byrne, Patrick and Nichols, Casey and Bharath, Aidan and Bichanich, Mason and Hunt, Jon and Raye, Robert and Monahan, Michael},
abstractNote = {This data was collected between October 12 and December 15 of 2021 at the University of New Hampshire (UNH) and Atlantic Marine Energy Center (AMEC) turbine deployment platform (TDP). This data set includes over 29 days of grid connected turbine operation during this 65 day time frame. The priority for this measurement campaign was to collect data while the turbine was electrically connected to the grid by means of a rectifier and inverter. The Fall_2021_UNH_Measurement_Timeline.png highlights when each instrument was functioning and the Fall_2021_UNH_Test_Log.jpg indicates the four main regions for analysis available from this measurement campaign.


The TDP is a floating structure moored on the Portsmouth facing side of Memorial Bridge pier #2, which spans the Piscataqua River between Portsmouth, NH and Kittery, ME. The Piscataqua River connects the Great Bay Estuary to the Gulf of Maine and the river currents are dominated by tidal forcing with water velocities exceeding 2.5 m/s during spring ebb tides at this site which were previously characterized by Kaelin Chancey (Assessment Of The Localized Flow And Tidal Energy Conversion System At An Estuarine Bridge - UNH MS Thesis 2019).


The turbine under test was a modified New Energy Corporation (Calgary, CA) model EVG-025 4-blade H-Darrius type vertical axis cross flow turbine that rotates in the clockwise direction with a rotor diameter of 3.2m and blade length of 1.7m. The hydro-foil profile was a NACA 0021 with a 10 inch chord length and a blade preset pitch angle of +4deg with a positive angle corresponding with the toe in direction. The standard EVG-025 has a rotor diameter of 3.4m and its rated power output is 25kW at 3 m/s. The rotor diameter was reduced to accommodate the size of the existing TDP moon-pool.


This project was pursued to quantify device performance for cross flow turbines operating in a marine environment. Accurate physical models, to characterize cross flow turbine performance, require real operational data sets due to the complexity of blade fluid interactions. This data can help support model development which will help predict turbine performance when analyzing perspective project locations in the future. Instrumentation was deployed to measure; water speed/direction, electrical power output, turbine shaft speed, turbine thrust force, and platform motion. Concurrent measurements of these parameters allow for correlations (cause and affect) to be inferred, allowing for characterization of device performance over a range of operating conditions.


Water currents were measured using Acoustic Doppler Current Profilers (ADCP's) and Acoustic Doppler Velocimeters (ADV's) directly upstream and downstream of the turbine for inflow, wake and turbulence measurements. Electrical power output was measured using the Voltsys rectifier and the Shark power meter. Shaft speed was calculated based on the Voltsys measurements of the permanent magnet three phase generator AC generation frequency, coupled directly to the cross flow turbine under test (i.e., no gear box). Platform motions were captured using a Yost IMU (inertial measurement unit). Turbine thrust loading was measured using a reaction arm about the turbine deployment platform spanning beam, where two bi-directional load cells were connected to the system via a pinned connection.


This submission includes zipped folders for each instrument containing quality controlled (QC'd) data in daily .csv files for the relevant duration specific to each instrument, along with separate .csv file that contains the units for each variable. Some instrument daily files are quite large and can pose a challenge for a visual spreadsheet editor to open. A processing software like MATLAB or Python is recommended. Note the degree of QC varied between each instrument due to time constraints. Particular time and attention was given to perform quality control tests on the acoustic based instruments that are particularly susceptible to erroneous data reporting. All variables across all instruments were verified for name and proper units. A complete reference on the QC tests performed and subsequent data reported here is available in 2022 - OByrne MS Thesis Chapter 4.


The zipped file structure, Data_Viewing_Matlab_Scripts, contains the same QC'd data reported in .csv files, but in .mat format, along with basic viewing and in depth processing scripts used to produce the results presented in 2022 - OByrne MS Thesis. To run the viewing and analysis and scripts available in the Data_Viewing_Matlab_scripts zip directory MATLAB R2021a is recommended.


The viewer is directed to 2022 - OByrne MS Thesis for an introduction to the platform and turbine under test.


Individual submissions will be created for each instrument to disseminate the raw data along with the .mat processing scripts used to create the final data set reported in this submission.},
url = {https://mhkdr.openei.org/submissions/394},
year = {2021},
howpublished = {Marine and Hydrokinetic Data Repository, National Renewable Energy Laboratory, https://doi.org/10.15473/1973860},
note = {Accessed: 2026-05-12},
doi = {10.15473/1973860}
}
https://dx.doi.org/10.15473/1973860
Details
Data from Dec 21, 2021
Last updated Jun 28, 2023
Submitted May 8, 2023
Organization
National Renewable Energy Laboratory
Contact
Aidan Bharath
303.384.6907
Authors
Keywords
MHK, Marine, Hydrokinetic, energy, power, Tidal, Living Bridge, Grid Connected, Experimental Data, Field Data, tidal current, cross-flow, cross flow, vertical axis, code, technology, processed data, MATLABDOE Project Details
Project Name UNH Field Measurement Campaign
Project Lead Lauren Ruedy
Project Number FY21 AOP 2.3.3.404